
LinkedIn Sales Navigator serves as a vital tool for B2B sales professionals, packing a suite of features tailored to enrich lead generation and client engagement. To fully leverage this tool, it is essential to monitor and understand various performance metrics associated with lead lists. These metrics assess how well your outreach initiatives are performing, provide quantitative measures of success, and are instrumental in informing strategic tweaks aimed at improving overall sales outcomes.

Definition of Performance Metrics
Performance metrics, in the context of LinkedIn Sales Navigator, pertain to quantifiable measures that assess the effectiveness of lead lists and sales activities. Metrics such as lead conversion rates, interaction frequencies, InMail response rates, and more, fall under this bracket. The analysis of these metrics provides sales professionals with valuable insights into the success quotient of their strategies and uncovers areas ripe for improvement.
Importance of Tracking Metrics
The practice of keeping an eye on performance metrics is critical for the following reasons:
- Informed Decision-Making: An understanding of which lead lists are yielding superior performance can guide sales teams in making informed, data-backed decisions to enhance their outreach.
- Optimization of Sales Strategies: The tracking of performance metrics can help identify tactics that work, allowing for their replication, and weed out ineffective practices.
- Enhanced Accountability: Performance metrics are quantifiable and offer a tangible measure of individual and team performance. This can foster motivation and drive continuous improvement among sales professionals.
- Benchmarking Success: The usage of historical data to establish benchmarks can help in setting pragmatic goals for future campaigns.
- Ready Adaptation to Market Changes: Regular reviews of performance metrics empower sales professionals to quickly adapt to market changes or shifts in customer preferences. This nimbleness is critical in ensuring competitiveness in the fast-paced B2B landscape.
By comprehending the significance of these performance metrics, B2B sales professionals can effectively harness LinkedIn Sales Navigator to elevate their lead generation efforts and achieve their sales objectives.
Stay tuned for the next section, where we will discuss the essential performance metrics that should be monitored within LinkedIn Sales Navigator to ensure high performance of lead lists.
Key Performance Metrics to Monitor
To effectively utilize LinkedIn Sales Navigator for successful B2B sales, particular key performance metrics that offer insights into the performance of your lead lists must be tracked. The following are just a few of these performance metrics and how to monitor them:
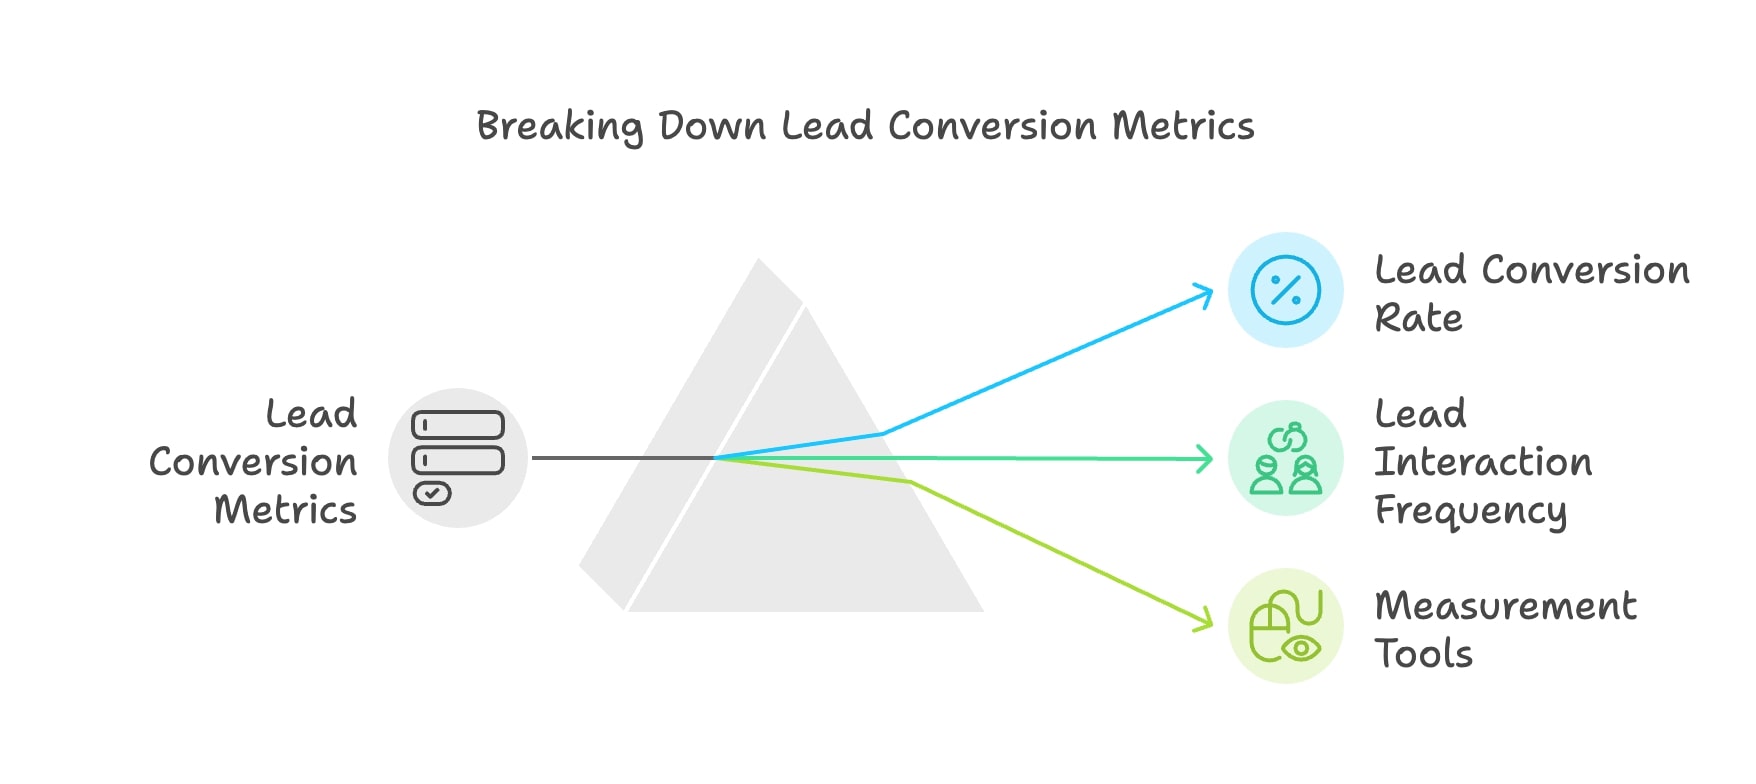
Lead Conversion Rates
Definition: The lead conversion rate pertains to the percentage of leads that successfully transition into becoming paying customers. This crucial metric evaluates the effectiveness of your lead generation initiatives.
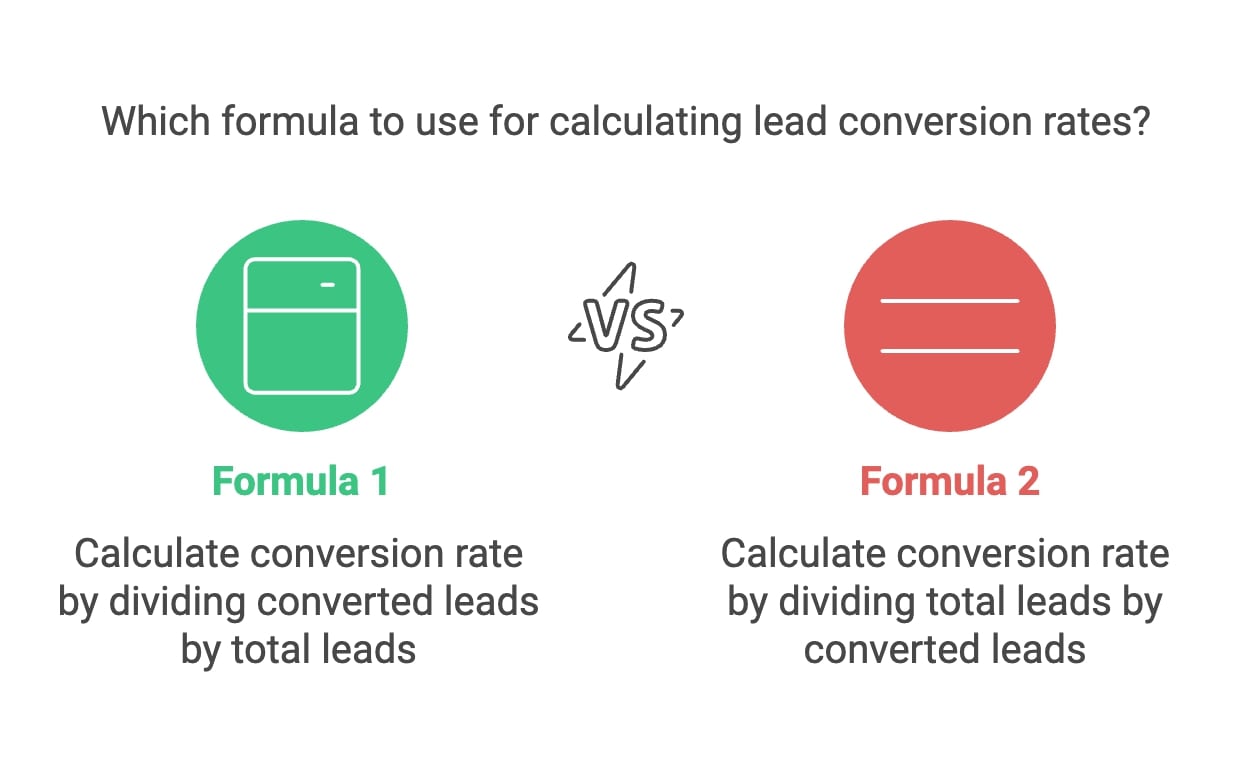
Calculation: Lead conversion rate can be calculated using this formula:
Lead Conversion Rate=(Number of Converted LeadsTotal Leads on the List)×100Lead Conversion Rate=(Total Leads on the ListNumber of Converted Leads)×100
Lead Interaction Frequency
Definition: This metric follows the frequency with which prospects engage with your content or respond to outreach efforts. Engagement may come in the form of likes, comments, shares, and responses to your messages.
Tools for Measurement: LinkedIn Sales Navigator has built-in features that offer insights into lead activity, effectively tracking interactions over a span. Tools like Hootsuite can scale up engagement analytics.
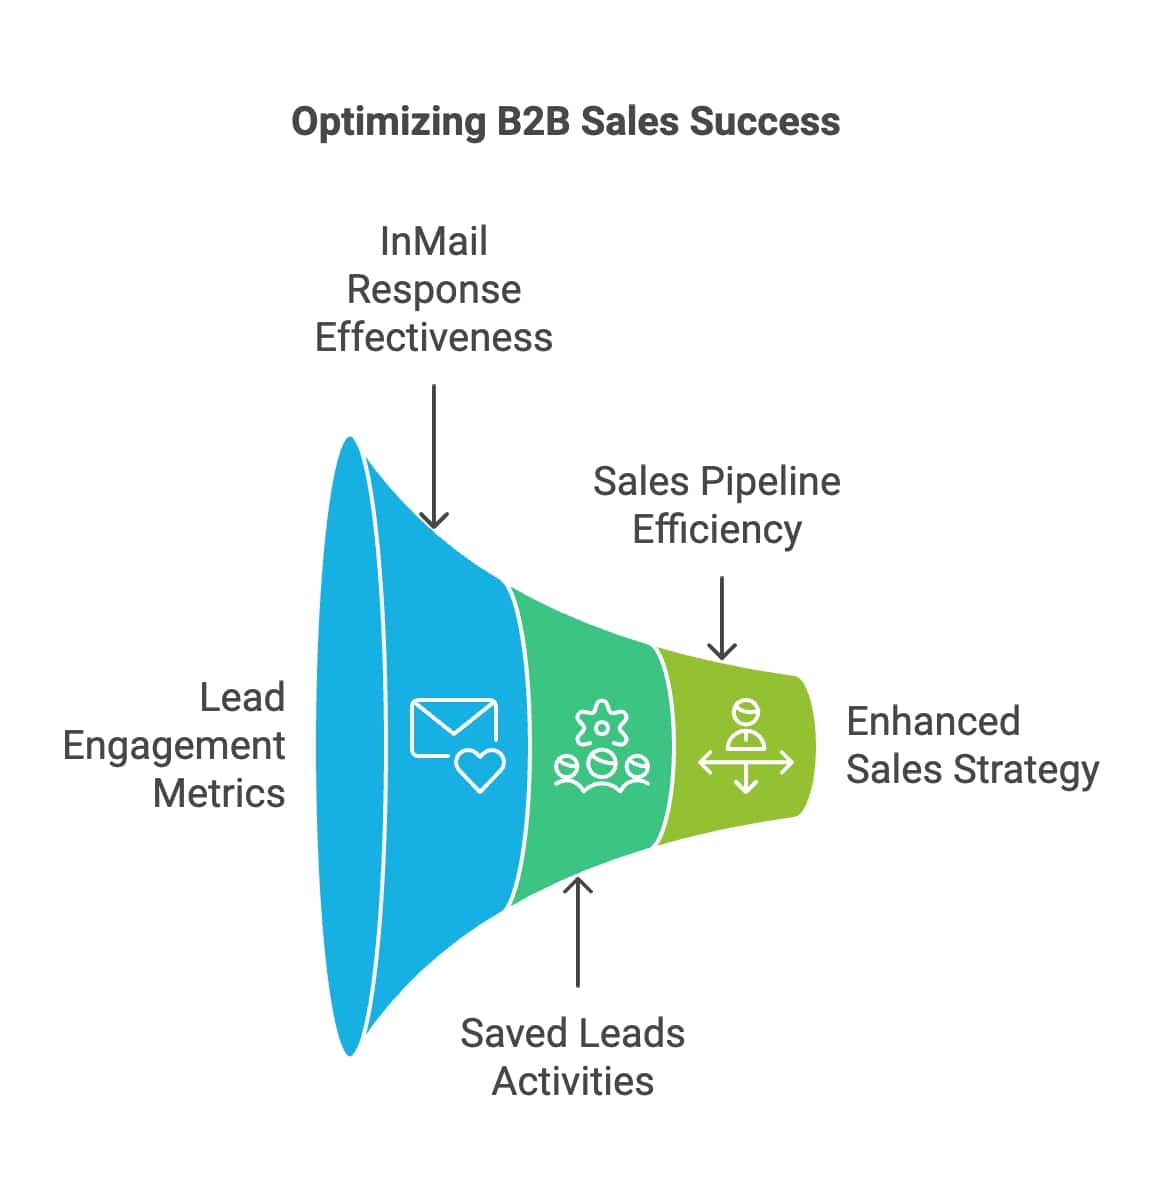
InMail Response Effectiveness
Definition: InMail response effectiveness refers to the percentage of InMail messages that receive a response from prospective leads. This metric gauges the impact of your messaging strategy.
Calculation: The InMail response effectiveness can be computed as follows:
InMail Response Effectiveness=(Number of Responses ReceivedTotal InMails Sent)×100InMail Response Effectiveness=(Total InMails SentNumber of Responses Received)×100
Activities of Saved Leads
Definition: Monitoring updates from saved leads, such as their job changes, promotions, or content shared comes under this metric. Leveraging this information allows for timely and relevant outreach.
Utilization Strategies: Sales Navigator provides alerts and notifications to keep you updated on the activities of lead lists.
Sales Pipeline Efficiency
Definition: Sales pipeline efficiency assesses how rapidly leads transition through the sales funnel's various stages—ranging from initial contact to closing the deal.
Metrics to Track: Key sub-metrics to observe under pipeline efficiency include the average time leads spend in each stage of the pipeline, drop-off rates at various stages, and the overall length of the sales cycle.
By keeping an eye on these crucial performance metrics—lead conversion rates, lead interaction frequency, InMail response effectiveness, activities concerning saved leads, and sales pipeline efficiency— B2B sales professionals are empowered with potent insights into lead list performance. This data-driven approach enables strategic adjustments that bolster outreach and, in turn, enhance overall sales success.
Detailed Breakdown of Each Metric
In the following sections, we delve into a detailed breakdown of the key lead list performance metrics applicable to LinkedIn Sales Navigator. Understanding how these metrics are calculated and their significance empowers B2B sales professionals to effectively optimize their strategies.
Lead Conversion Rates
How to Calculate:
Calculate lead conversion rates, using this formula:
Lead Conversion Rate=(Number of Converted LeadsTotal Number of Leads)×100Lead Conversion Rate=(Total Number of LeadsNumber of Converted Leads)×100
Example: If your sales team successfully converted 20 leads out of 200 generated, your conversion rate would be 10%.
Lead Interaction Frequency
Measuring Engagement: Interaction frequencies are derived by monitoring the number of times leads interact with your LinkedIn posts or respond to your messages.
Tools for Measurement: Platforms like Hootsuite offer detailed analytics to track your LinkedIn engagement metrics.
InMail Response Effectiveness
How to Calculate:
The formula to calculate the effectiveness of InMail responses is as follows:
InMail Response Rate=(Number of ResponsesTotal InMails Sent)×100InMail Response Rate=(Total InMails SentNumber of Responses)×100
Example: If you sent out 50 InMails and received 10 responses, your InMail response rate would be 20%.

Activities of Saved Leads
Monitoring Updates: Saved leads, such as changes in their job, promotions, or any content they share, can provide valuable clues about the lead's interests and recent activities.
Utilization Strategy: LinkedIn Sales Navigator users can set alerts alerts and notifications to stay updated on their leads' professional updates.
Sales Pipeline Efficiency
Measuring Efficiency: The measurement of sales pipeline efficiency can be broken down into three key meta-metrics:
- The average time a lead spends on each stage of the funnel
- Drop-off rates at each stage
- The overall length of the sales cycle
By keeping a keen eye on these critical performance metrics— lead conversion rates, frequency of lead interaction, InMail response effectiveness, activities of saved leads, and the efficiency of the sales pipeline— B2B sales professionals can furnish themselves with valuable insights into lead list performance. As we proceed, we will explore how automation and AI tools can enhance the tracking process, offering deeper insights into lead performance and metrics on LinkedIn Sales Navigator.
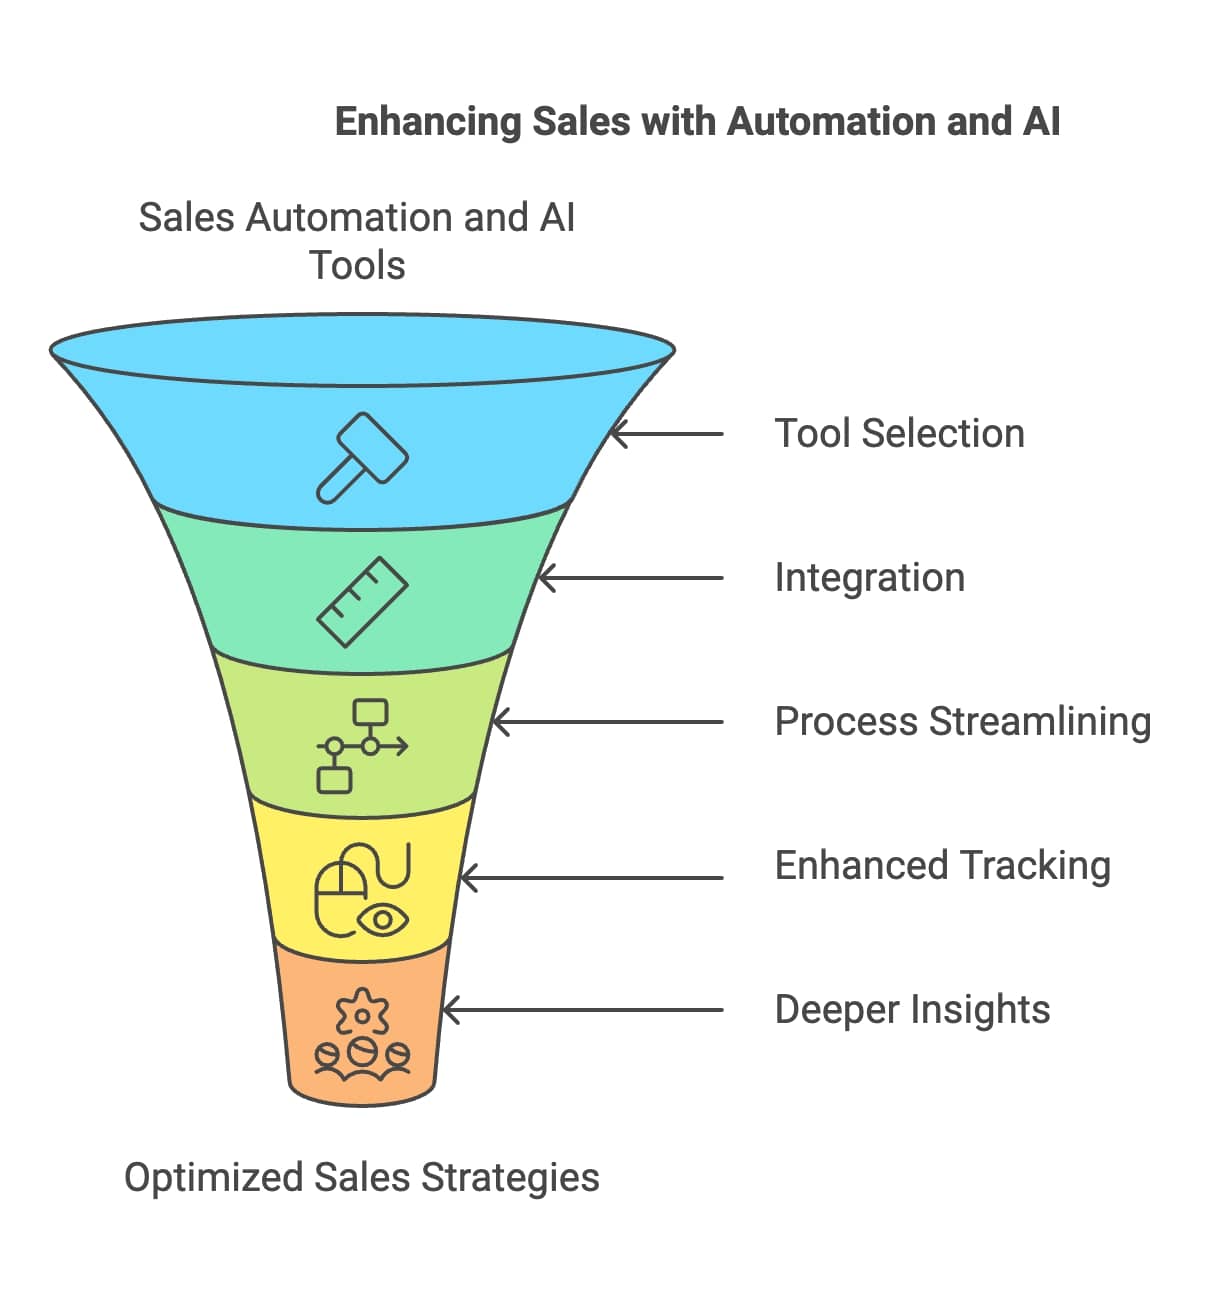
Utilizing Automation and AI for Enhanced Tracking
As the competitive landscape of sales continues to evolve, leveraging automation and artificial intelligence (AI) can greatly enhance the tracking of lead list performance metrics in LinkedIn Sales Navigator. Below, we explore some of these technologies and how they streamline processes, boost accuracy, and offer deep insights into lead behavior.
Sales Automation Tools
- Understanding Automation in Sales:
Sales automation refers to the usage of software tools for automating repetitious tasks. Settings within LinkedIn Sales Navigator allow automated tracking of engagement metrics, manages outreach efforts, and analyzes lead performance efficiently. - Automation Tools You Can Consider:
- Dux-Soup: This browser extension for LinkedIn automates tasks like profile visits and connection requests besides tracking engagement metrics for leads.
- Phantombuster: This tool allows users to automate various LinkedIn actions, such as sending connection requests or extracting data based on specific criteria.
- Zapier: Zapier can automate workflows that involve LinkedIn Sales Navigator and other applications.
- Perks of Employing Automation:
- Time Savings: Automation saves time for sales professionals, offering them the convenience to concentrate on aspects like relationship building.
- Enhanced Tracking: Real-time data on lead interactions and engagement metrics are readily available with automated tools.
AI in Sales Navigator
- AI in LinkedIn Sales Navigator:
AI-powered features in LinkedIn Sales Navigator offer a superior user experience and valuable insights into lead performance. - AI Tools to Consider:
- Predictive Analytics: AI algorithms analyze historical data to predict lead behavior and interactions.
- Lead Recommendations: Sales Navigator uses AI to recommend leads that align with your existing connections and past interactions.
Implementing Automation and AI in Your Sales Strategy
- Select Appropriate Tools: Pick automation and AI tools that resonate with your sales objectives. Aspects to consider include ease of use, integration capabilities, and the depth of the features offered.
- Integration with Existing Systems: Ensure the automation tools you use align well with your existing CRM or sales management systems.
- Stay Up-to-Date on Technological Developments: With the landscape of technology evolving rapidly, it is beneficial to stay abreast with the latest developments in automation and AI.
By making the most of automation and AI within LinkedIn Sales Navigator, B2B sales professionals can enhance their tracking processes, gain deeper insights into lead behavior, and optimize their outreach strategies for better sales outcomes.
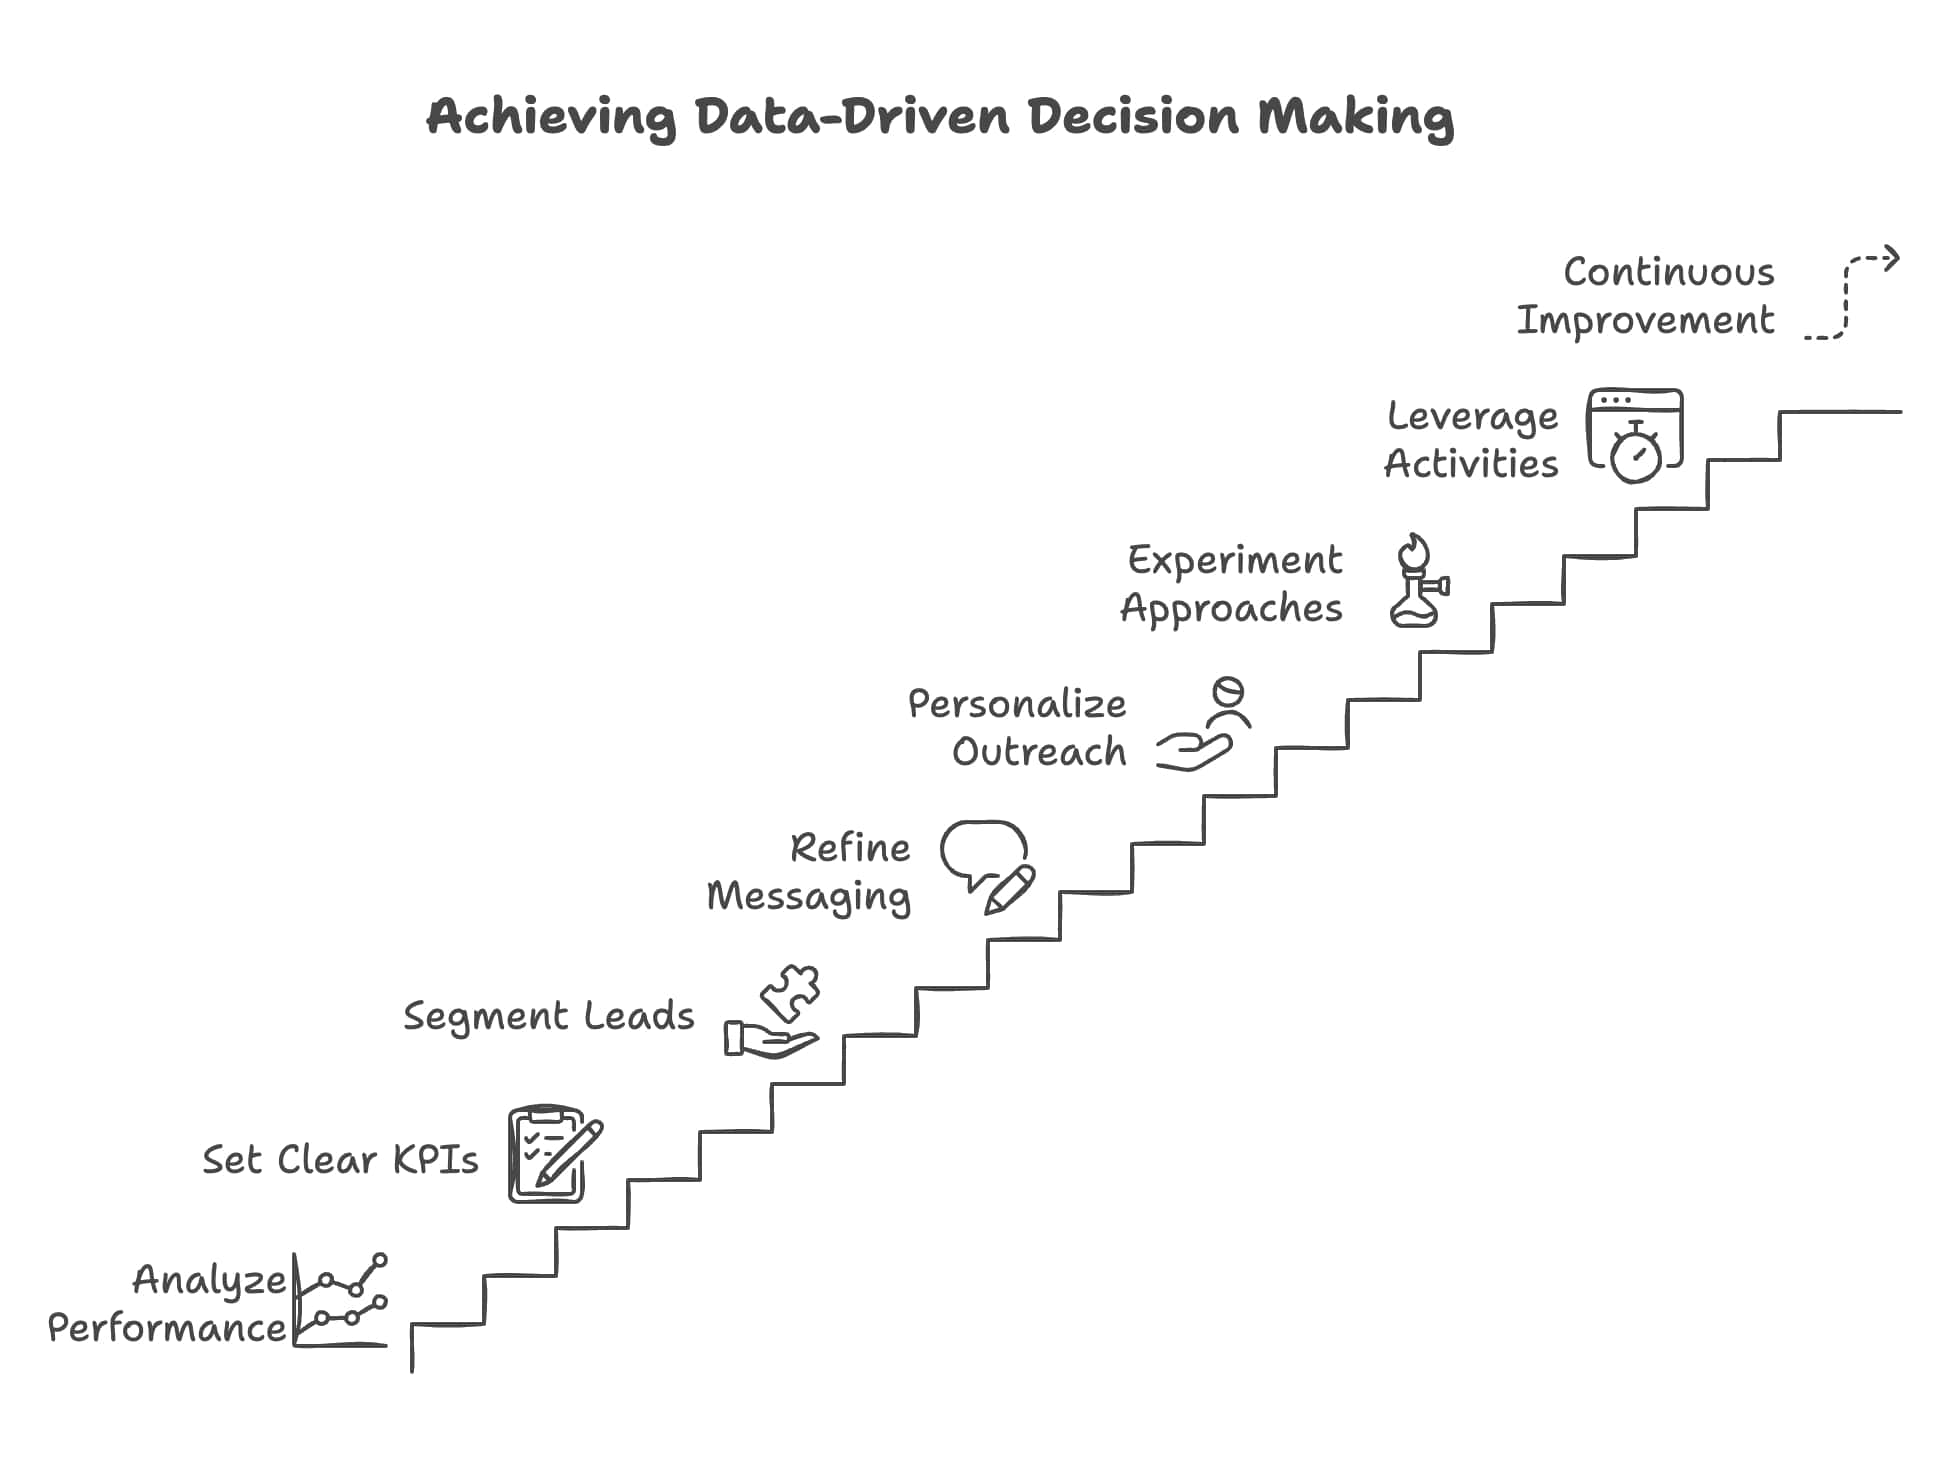
Refining Sales Tactics Based on Data Insights
After analyzing performance metrics from LinkedIn Sales Navigator, it's crucial to use these insights to refine your sales tactics. B2B sales professionals can leverage these data insights to make informed decisions that enhance outreach strategies, improve lead engagement, and boost conversion rates. In this section, we'll take a look at key strategic adjustments to refine your sales tactics:
Data-Driven Decision Making
- Analyze Historical Performance: Regularly review historical performance metrics to identify trends and patterns in lead behavior. This analysis might reveal which types of content consistently drive higher engagement and are worth pursuing.
- Set Clear KPIs: Establish key performance indicators (KPIs) that align with your goals. Common KPIs include conversion rates, response rates, and engagement frequency. These KPIs will guide your measures of success and calibrate your strategies accordingly.
- Segmentation of Leads: Data insights can guide you to segment your leads - a process that groups leads based on their characteristics (industry, job title, etc) or engagement history. Tailored messaging and outreach efforts for these specific segments can vastly improve response rates.
Messaging and Targeting Adjustments
- Refine Your Messaging: Insights from metrics such as InMail response effectiveness and lead interaction frequency can help you refine messaging. If you find specific topics or dialogue resonating with your audience, consider weaving them into future communications.
- Personalize Your Outreach: Personalization of outreach efforts goes a long way. Use data about lead activities such as job changes or content engagement to share messages that resonate on a personal level and stand out.
- Experiment with Different Approaches: Implement A/B testing with different messaging strategies or content types. This could be as simple as experimenting with varying subject lines in InMails, or trying different types of content (like videos versus articles), in order to discover what generates superior engagement.
Leveraging Lead Activities for Timely Outreach
- Set Up Alerts for Lead Activities: Keeping informed about your leads' professional updates such as job changes or content shares can be done by setting alerts in LinkedIn Sales Navigator. This ensures timely and relevant outreach.
- Engage with Relevant Content: If a lead shares an article or post relevant to your industry, seize the opportunity to engage by commenting or sharing your insights. This showcases your interest and keeps you in their awareness loop.
Continuous Improvement
- Regularly Review Performance Metrics: Make it a habit to routinely (weekly or monthly) review your performance metrics. This practice helps you stay on track with your goals and identify areas that require improvement.
- Stay Agile: The B2B landscape is dynamic and constantly changing. To stay competitive, sales professionals must stay flexible and adapt their strategies with changing customer needs and market trends.
Common Mistakes in Tracking Performance Metrics
While tracking performance metrics in LinkedIn Sales Navigator is essential for optimizing sales strategies, there are several common mistakes that B2B sales professionals often make. Recognizing and avoiding these pitfalls can help ensure that your tracking efforts yield meaningful insights and drive better results. Here are some key mistakes to watch out for:
1. Neglecting Key Metrics
Mistake: Focusing solely on one or two metrics while ignoring others can lead to an incomplete understanding of your lead list performance. For example, if you only track conversion rates without monitoring engagement levels, you may miss critical insights into how leads are interacting with your content.
Solution: Develop a comprehensive dashboard that includes all relevant performance metrics, such as lead conversion rates, InMail response rates, interaction frequency, and pipeline efficiency. Regularly review this dashboard to gain a holistic view of your sales efforts.
2. Inconsistent Monitoring
Mistake: Failing to monitor performance metrics consistently can result in missed opportunities for improvement. For instance, if you only review metrics sporadically, you may overlook trends or shifts in lead behavior that require immediate attention.
Solution: Establish a regular schedule for reviewing performance metrics—ideally on a weekly or monthly basis. Consistent monitoring allows you to identify trends over time and make timely adjustments to your strategies.
3. Ignoring Contextual Factors
Mistake: Analyzing metrics in isolation without considering external factors can lead to misinterpretations. For example, a sudden drop in InMail response rates might be attributed solely to messaging issues, while external factors like economic changes or industry trends could also be influencing lead behavior.
Solution: When analyzing performance metrics, consider the broader context. Stay informed about industry trends, market conditions, and changes in customer behavior that may impact your results.
4. Failure to Adapt Strategies
Mistake: Not adjusting outreach strategies based on data insights can hinder success. For example, if you notice that certain types of content generate higher engagement but continue to focus on less effective formats, you may miss opportunities for improvement.
Solution: Use the insights gained from performance metrics to inform strategic adjustments. Be proactive in adapting your messaging and outreach efforts based on what the data reveals about lead preferences and behaviors.
5. Overlooking Lead Segmentation
Mistake: Treating all leads as a homogeneous group without segmenting them based on characteristics such as industry, job title, or engagement history can limit the effectiveness of your outreach efforts.
Solution: Segment your leads into distinct categories based on relevant criteria. Tailor your messaging and strategies for each segment to ensure that your outreach resonates with their specific needs and interests.
6. Not Utilizing Available Tools
Mistake: Underutilizing the features available in LinkedIn Sales Navigator and other analytics tools can result in missed opportunities for deeper insights into lead performance.
Solution: Familiarize yourself with all the features offered by Sales Navigator, including alerts for lead activities and advanced search filters. Additionally, consider integrating third-party analytics tools that can provide enhanced tracking capabilities.
Conclusion
In the competitive landscape of B2B sales, leveraging LinkedIn Sales Navigator effectively is crucial for optimizing lead generation and enhancing sales performance. Throughout this blog post, we have explored the importance of tracking lead list performance metrics and how these metrics can inform strategic decisions to drive better results. Here are the key takeaways:
Key Findings
- Understanding Performance Metrics: Performance metrics are vital for evaluating the effectiveness of your lead lists. Metrics such as lead conversion rates, interaction frequency, InMail response effectiveness, activities of saved leads, and sales pipeline efficiency provide valuable insights into your outreach efforts.
- Key Metrics to Monitor: Regularly tracking key performance metrics allows sales professionals to identify trends, assess engagement levels, and make data-driven decisions. High conversion rates and interaction frequencies are indicators of successful outreach strategies.
- Detailed Breakdown of Each Metric: Understanding how to calculate and interpret each metric is essential for effective analysis. For example, calculating lead conversion rates helps set benchmarks for success, while monitoring InMail response effectiveness can guide messaging strategies.
- Utilizing Automation and AI: Automation tools and AI insights can significantly enhance the tracking process, providing deeper insights into lead behavior and streamlining outreach efforts. Tools like Dux-Soup and Phantombuster can automate repetitive tasks while AI features in Sales Navigator offer predictive analytics for prioritizing leads.
- Refining Sales Tactics Based on Data Insights: Data-driven decision-making enables sales professionals to refine their messaging, personalize outreach efforts, and engage with leads at the right moments. Continuous improvement based on performance metrics is key to maintaining a competitive edge.
- Avoiding Common Mistakes: Being aware of common mistakes—such as neglecting key metrics, inconsistent monitoring, ignoring contextual factors, and failing to adapt strategies—can help sales teams maximize their effectiveness in tracking performance metrics.
Final Thoughts
By implementing a robust system for tracking lead list performance metrics in LinkedIn Sales Navigator, B2B sales professionals can enhance their outreach strategies and drive better engagement with potential clients. The insights gained from these metrics not only inform immediate actions but also contribute to long-term success in building relationships and closing deals.As you move forward with your sales efforts on LinkedIn, remember that continuous learning and adaptation are essential components of success. Stay informed about industry trends, leverage the latest tools and technologies, and be proactive in refining your strategies based on data insights.
FAQ Section
What are the most important metrics to track in LinkedIn Sales Navigator?
Key metrics include lead conversion rates, InMail response rates, interaction frequency, activities of saved leads, and sales pipeline efficiency.
How can I improve my lead conversion rates?
Focus on personalizing outreach efforts, refining messaging based on data insights, and ensuring consistent follow-up with leads.
What tools can help automate tracking in Sales Navigator?
Tools like Dux-Soup, Phantombuster, Zapier, and various CRM integrations can automate tracking processes and enhance efficiency.
How often should I review my performance metrics?
It’s advisable to review performance metrics regularly—ideally weekly or monthly—to track progress toward goals and identify areas for improvement.
What common mistakes should I avoid when tracking lead performance?
Avoid neglecting key metrics, inconsistent monitoring, ignoring contextual factors, failing to adapt strategies based on insights, overlooking lead segmentation, and underutilizing available tools.
Check other articles you may want to look up:
Best 10 Twitter Email Finder Tools 2024
Top 10 LinkedIn Email Finder Chrome Extensions
How To Find Someones Email On Twitter?

